

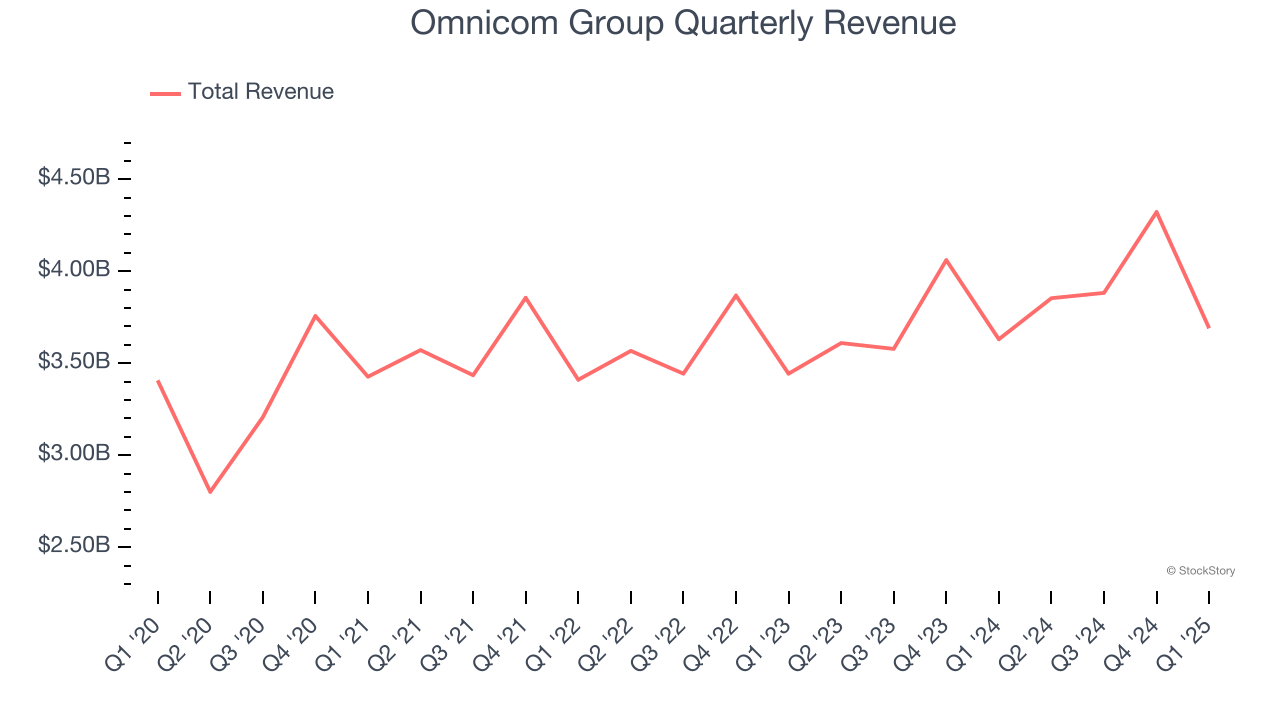
Global advertising giant Omnicom Group (NYSE:OMC) missed Wall Street’s revenue expectations in Q1 CY2025 as sales only rose 1.6% year on year to $3.69 billion. Its non-GAAP profit of $1.70 per share was 2.3% above analysts’ consensus estimates.
Is now the time to buy Omnicom Group? Find out by accessing our full research report, it’s free.
Omnicom Group (OMC) Q1 CY2025 Highlights:
- Revenue: $3.69 billion vs analyst estimates of $3.71 billion (1.6% year-on-year growth, 0.6% miss)
- Adjusted EPS: $1.70 vs analyst estimates of $1.66 (2.3% beat)
- Adjusted EBITDA: $511.6 million vs analyst estimates of $534.9 million (13.9% margin, 4.4% miss)
- Operating Margin: 12.3%, in line with the same quarter last year
- Organic Revenue rose 3.4% year on year, in line with the same quarter last year
- Market Capitalization: $15.05 billion
"Organic revenue growth for the first quarter was 3.4%. We are assessing the implications of economic and market events to determine how they will affect our clients and business for the remainder of 2025. While uncertainty has increased, one thing hasn't changed and will always be true – Omnicom is a trusted partner for our clients, offering strategic advice to grow their sales while delivering flexibility, value and performance," said John Wren, Chairman and Chief Executive Officer of Omnicom.
Company Overview
With a vast network of creative agencies that helped craft some of the most memorable ad campaigns in history, Omnicom Group (NYSE:OMC) is a strategic holding company that provides advertising, marketing, and communications services to many of the world's largest companies.
Advertising & Marketing Services
The sector is on the precipice of both disruption and growth as AI, programmatic advertising, and data-driven marketing reshape how things are done. For example, the advent of the Internet broadly and programmatic advertising specifically means that brand building is not a relationship business anymore but instead one based on data and technology, which could hurt traditional ad agencies. On the other hand, the companies in the sector that beef up their tech chops by automating the buying of ad inventory or facilitating omnichannel marketing, for example, stand to benefit. With or without advances in digitization and AI, the sector is still highly levered to the macro, and economic uncertainty may lead to fluctuating ad spend, particularly in cyclical industries.
Sales Growth
Reviewing a company’s long-term sales performance reveals insights into its quality. Even a bad business can shine for one or two quarters, but a top-tier one grows for years.
With $15.75 billion in revenue over the past 12 months, Omnicom Group is a behemoth in the business services sector and benefits from economies of scale, giving it an edge in distribution. This also enables it to gain more leverage on its fixed costs than smaller competitors and the flexibility to offer lower prices. However, its scale is a double-edged sword because it’s challenging to maintain high growth rates when you’ve already captured a large portion of the addressable market. For Omnicom Group to boost its sales, it likely needs to adjust its prices, launch new offerings, or lean into foreign markets.
As you can see below, Omnicom Group grew its sales at a sluggish 1.1% compounded annual growth rate over the last five years. This shows it failed to generate demand in any major way and is a rough starting point for our analysis.
We at StockStory place the most emphasis on long-term growth, but within business services, a half-decade historical view may miss recent innovations or disruptive industry trends. Omnicom Group’s annualized revenue growth of 4.9% over the last two years is above its five-year trend, but we were still disappointed by the results. 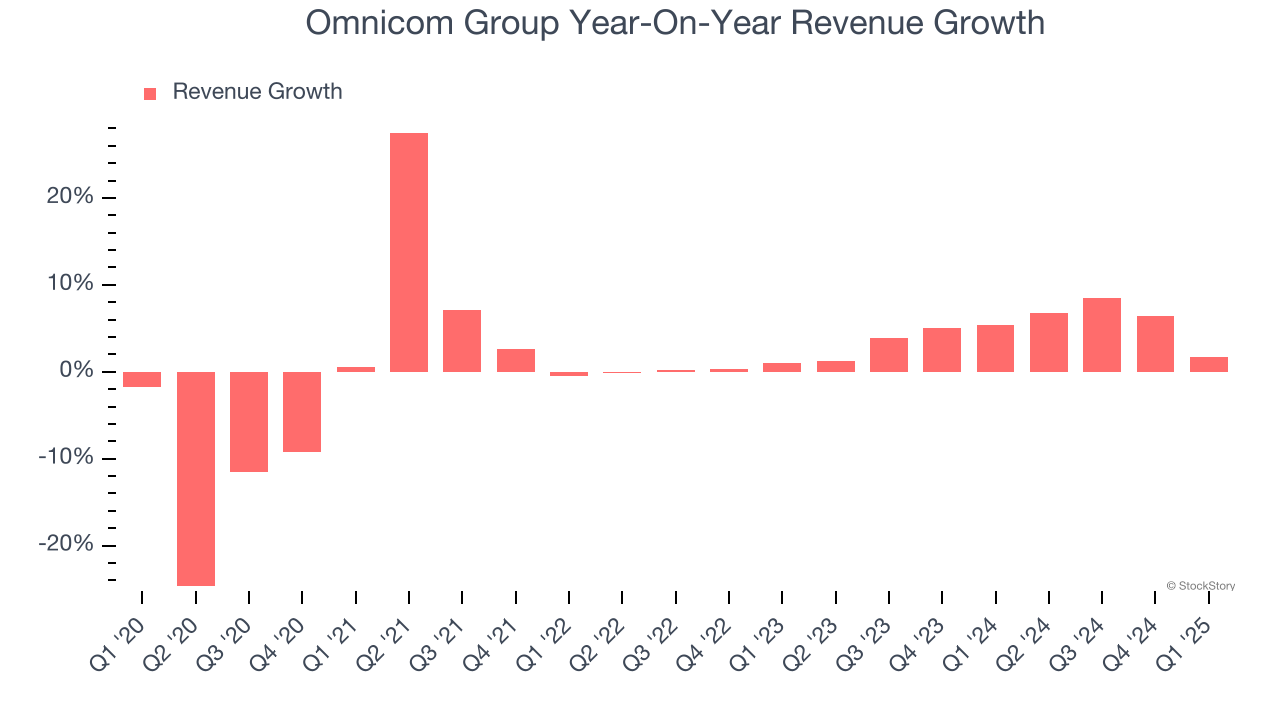
Omnicom Group also reports organic revenue, which strips out one-time events like acquisitions and currency fluctuations that don’t accurately reflect its fundamentals. Over the last two years, Omnicom Group’s organic revenue averaged 4.4% year-on-year growth. Because this number aligns with its normal revenue growth, we can see the company’s core operations (not acquisitions and divestitures) drove most of its results. 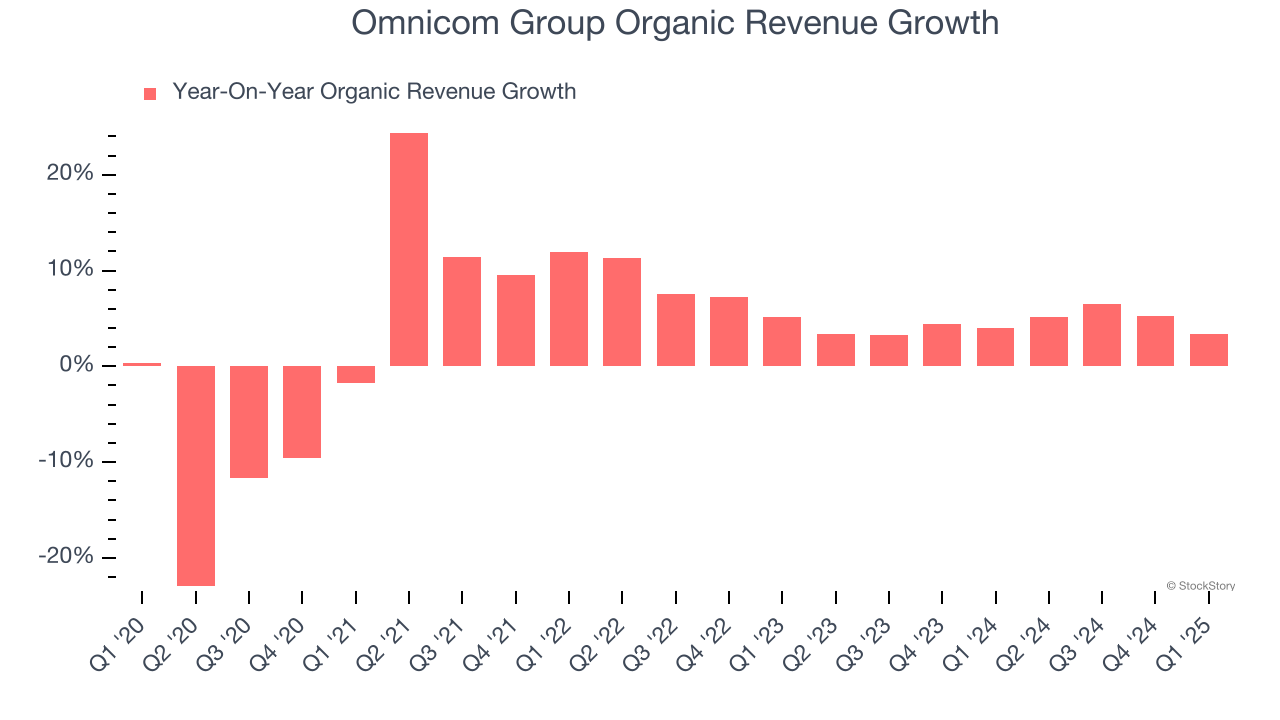
This quarter, Omnicom Group’s revenue grew by 1.6% year on year to $3.69 billion, falling short of Wall Street’s estimates.
Looking ahead, sell-side analysts expect revenue to grow 2.3% over the next 12 months, a slight deceleration versus the last two years. This projection doesn't excite us and suggests its products and services will see some demand headwinds.
Software is eating the world and there is virtually no industry left that has been untouched by it. That drives increasing demand for tools helping software developers do their jobs, whether it be monitoring critical cloud infrastructure, integrating audio and video functionality, or ensuring smooth content streaming. Click here to access a free report on our 3 favorite stocks to play this generational megatrend.
Operating Margin
Omnicom Group has been an efficient company over the last five years. It was one of the more profitable businesses in the business services sector, boasting an average operating margin of 14.2%.
Looking at the trend in its profitability, Omnicom Group’s operating margin rose by 1.8 percentage points over the last five years, as its sales growth gave it operating leverage.
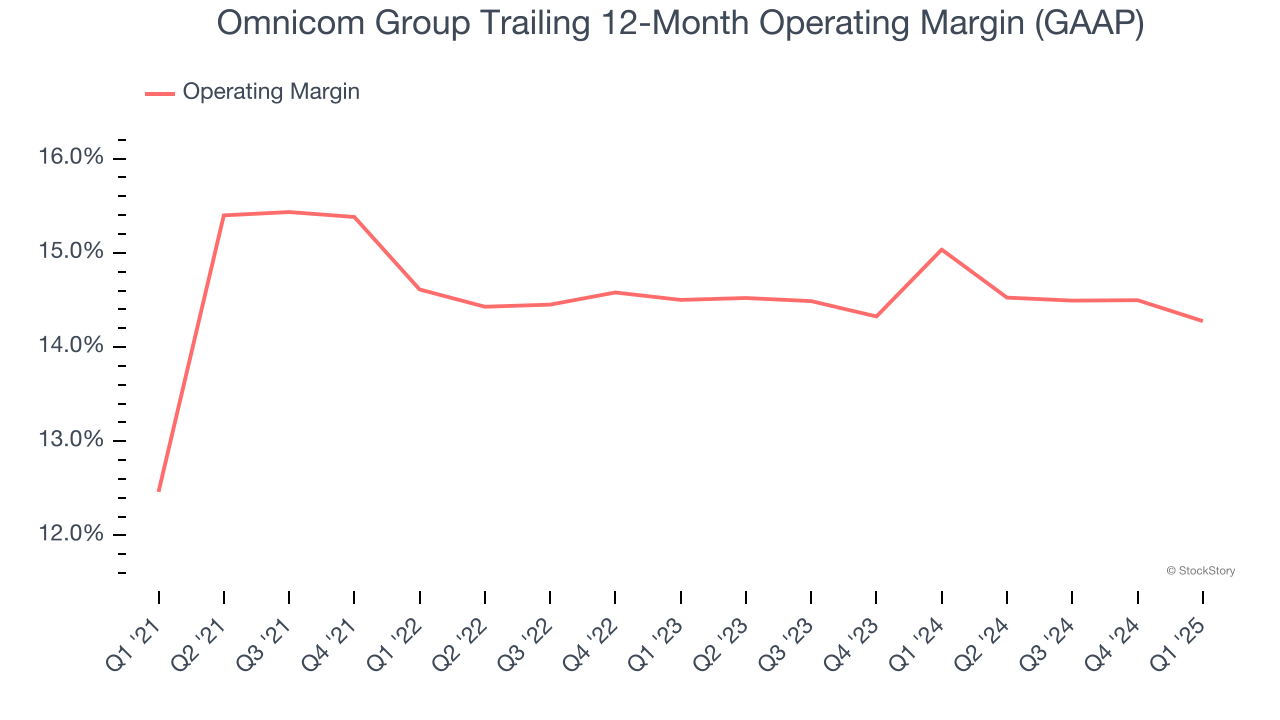
In Q1, Omnicom Group generated an operating profit margin of 12.3%, in line with the same quarter last year. This indicates the company’s overall cost structure has been relatively stable.
Earnings Per Share
Revenue trends explain a company’s historical growth, but the long-term change in earnings per share (EPS) points to the profitability of that growth – for example, a company could inflate its sales through excessive spending on advertising and promotions.
Omnicom Group’s EPS grew at an unimpressive 5.9% compounded annual growth rate over the last five years. On the bright side, this performance was better than its 1.1% annualized revenue growth and tells us the company became more profitable on a per-share basis as it expanded.
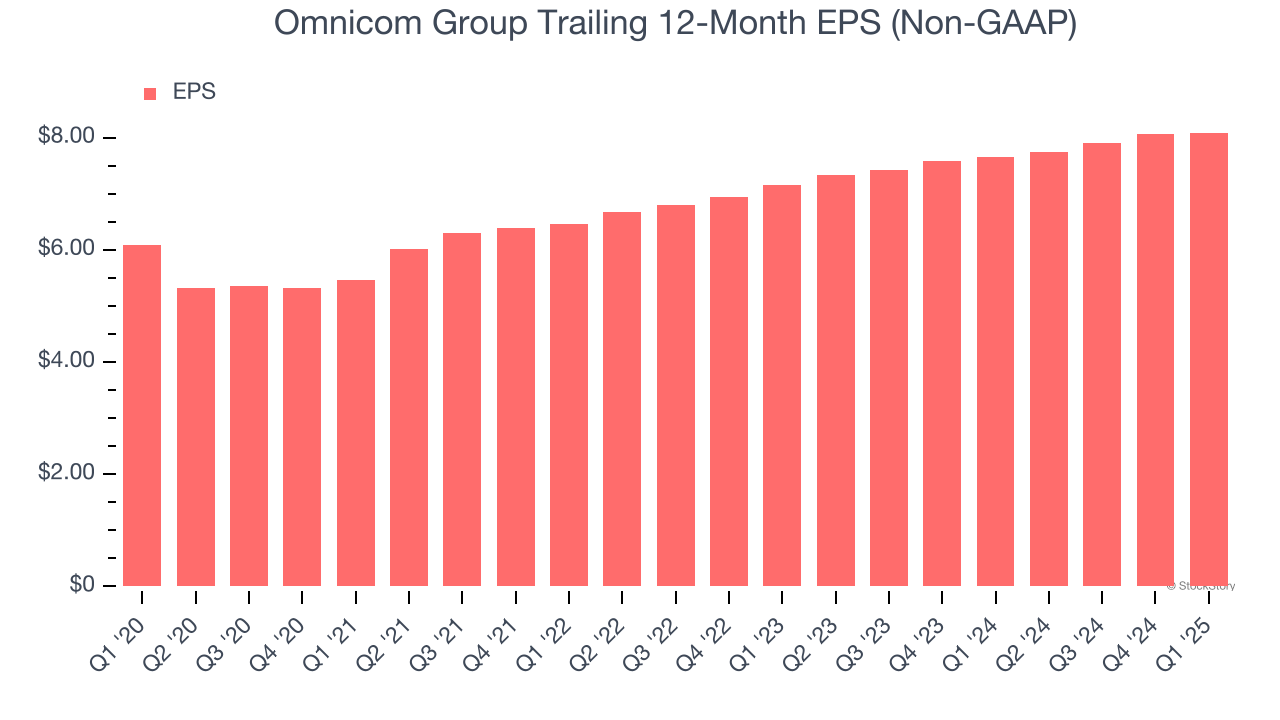
We can take a deeper look into Omnicom Group’s earnings to better understand the drivers of its performance. As we mentioned earlier, Omnicom Group’s operating margin was flat this quarter but expanded by 1.8 percentage points over the last five years. On top of that, its share count shrank by 8.8%. These are positive signs for shareholders because improving profitability and share buybacks turbocharge EPS growth relative to revenue growth. 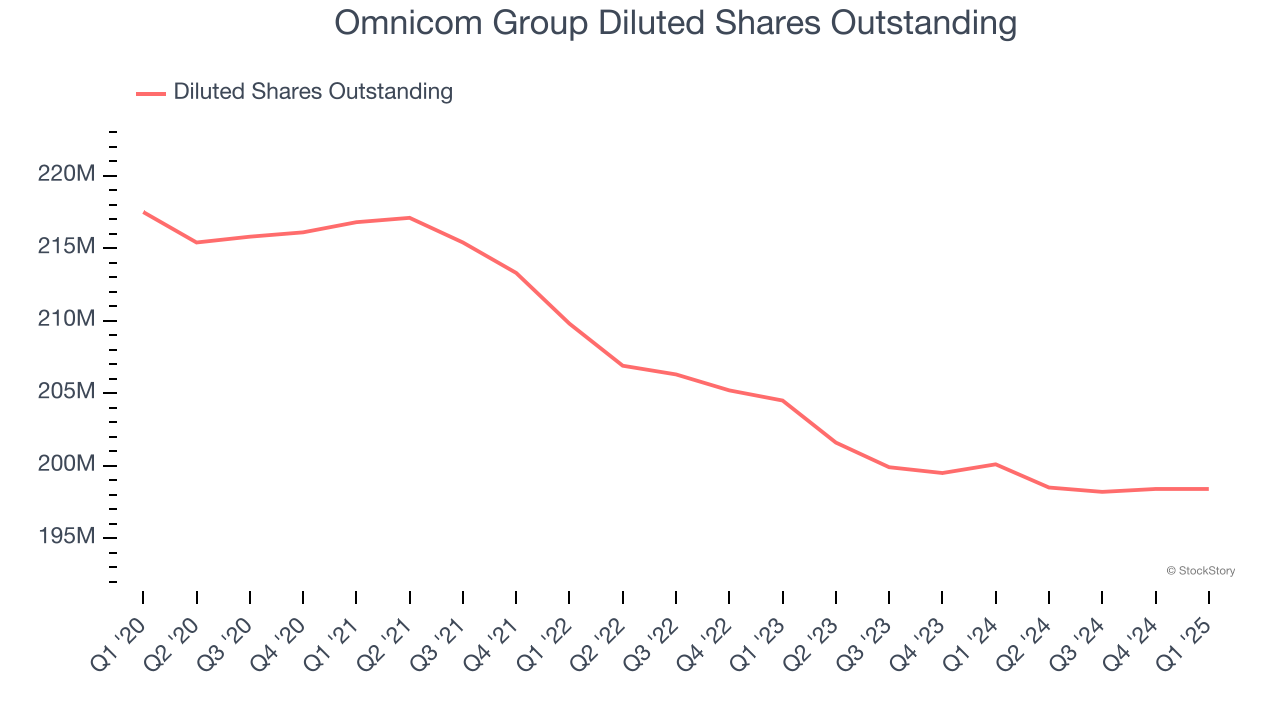
In Q1, Omnicom Group reported EPS at $1.70, up from $1.67 in the same quarter last year. This print beat analysts’ estimates by 2.3%. Over the next 12 months, Wall Street expects Omnicom Group’s full-year EPS of $8.09 to grow 5%.
Key Takeaways from Omnicom Group’s Q1 Results
It was encouraging to see Omnicom Group beat analysts’ EPS expectations this quarter. On the other hand, its revenue and EBITDA missed. Overall, this was a softer quarter. The stock remained flat at $76.50 immediately after reporting.
So should you invest in Omnicom Group right now? The latest quarter does matter, but not nearly as much as longer-term fundamentals and valuation, when deciding if the stock is a buy. We cover that in our actionable full research report which you can read here, it’s free.